

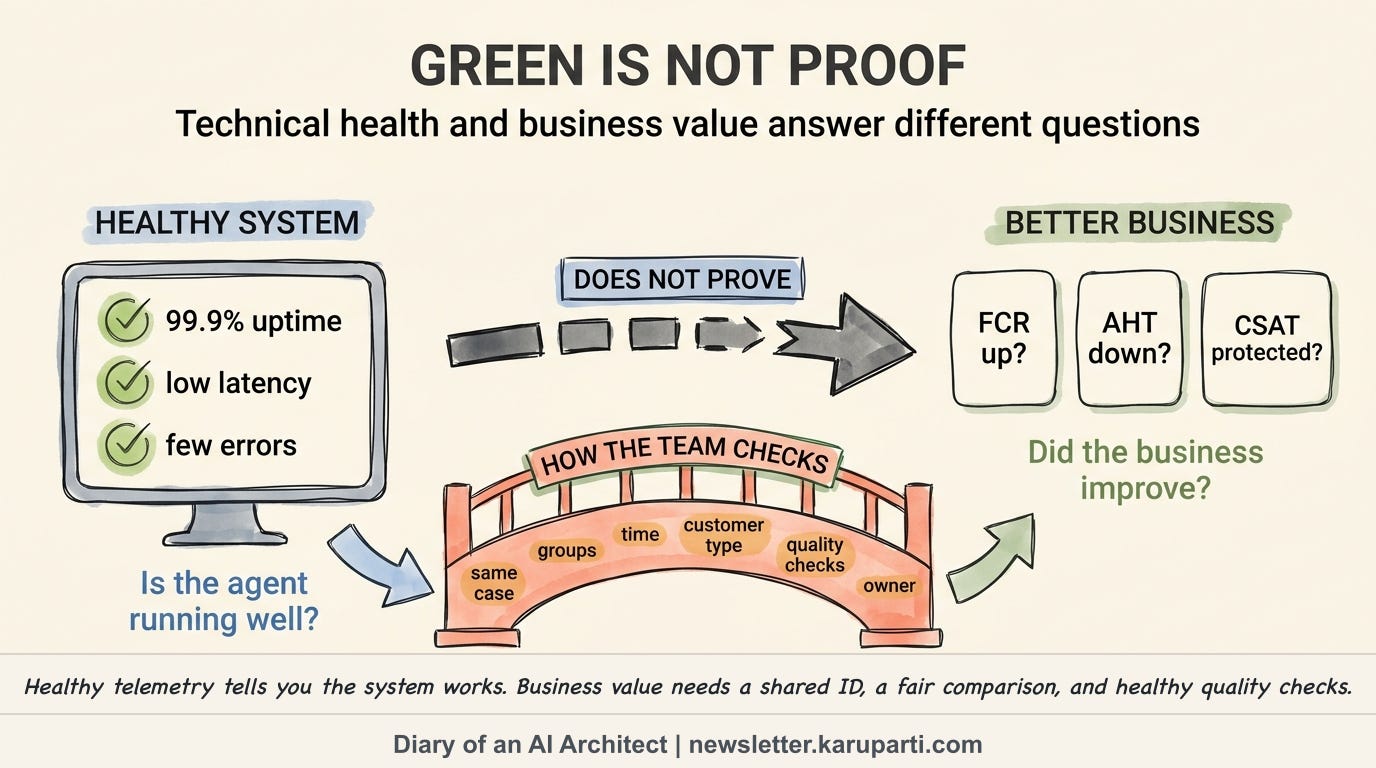
Your AI agent can report 99.9% uptime and still be a business failure. The number is illustrative, but the architecture problem is real: a green dashboard cannot tell you whether the business got better.
This week in my diary, I am working through the missing outcome-translation layer between an agent trace and the KPI a business owner is actually paid to move.
Observability tells me how the system behaved. It can show model latency, token usage, errors, tool calls, workflow duration, and agent trajectories. Those signals are necessary for operating production AI.
They are not the same as business outcomes.
The dashboard that answered the wrong question
Picture Maya, the VP of Customer Service at a national retailer. Her team deploys an AI agent to help customers resolve order and return questions.
Two weeks later, the engineering review looks excellent. The dashboard shows 1.8-second latency, a 92% task success rate, and a 1.4% error rate. Every figure in this scenario is illustrative.
Maya asks three questions:
Did average handle time (AHT) fall?
Did first-contact resolution (FCR) improve?
Did customer satisfaction (CSAT) move?
Nobody can answer. The agent telemetry lives in the observability platform. The business outcomes live in the contact-center and case-management systems. The two datasets do not share a governed measurement contract.
The team has built a beautiful speedometer without connecting it to the destination.
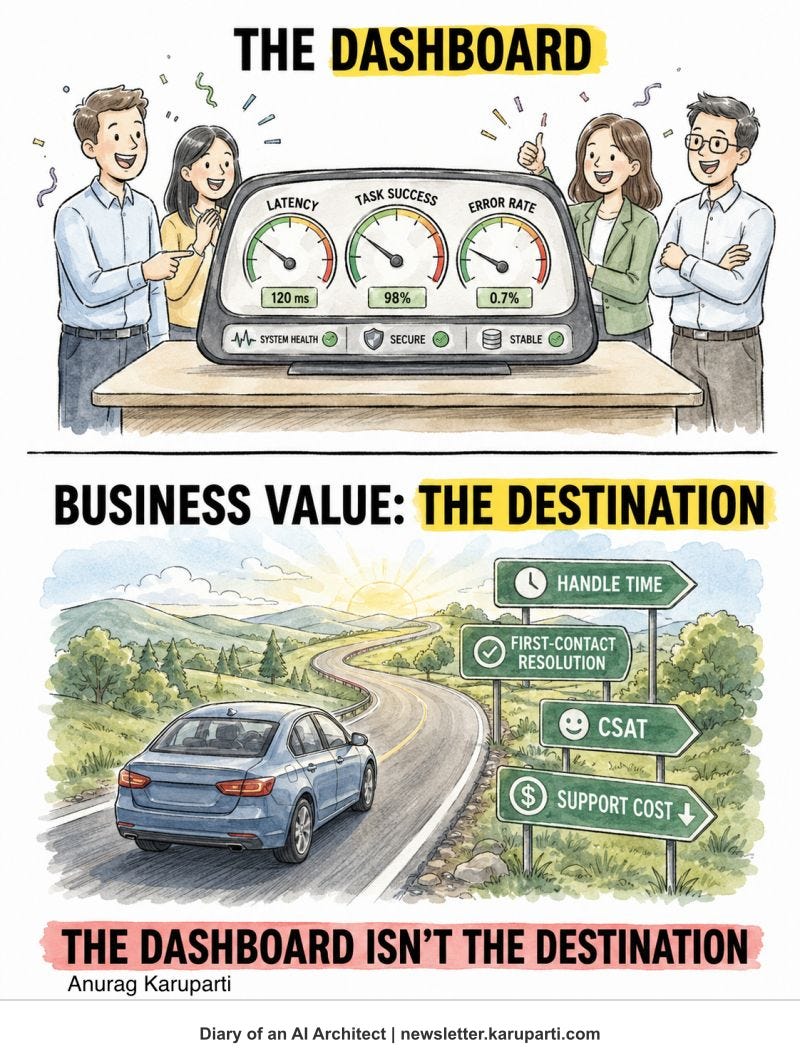
All values shown in this supplied illustration, like the scenario figures in this article, are illustrative.
The framework: observability versus outcome translation
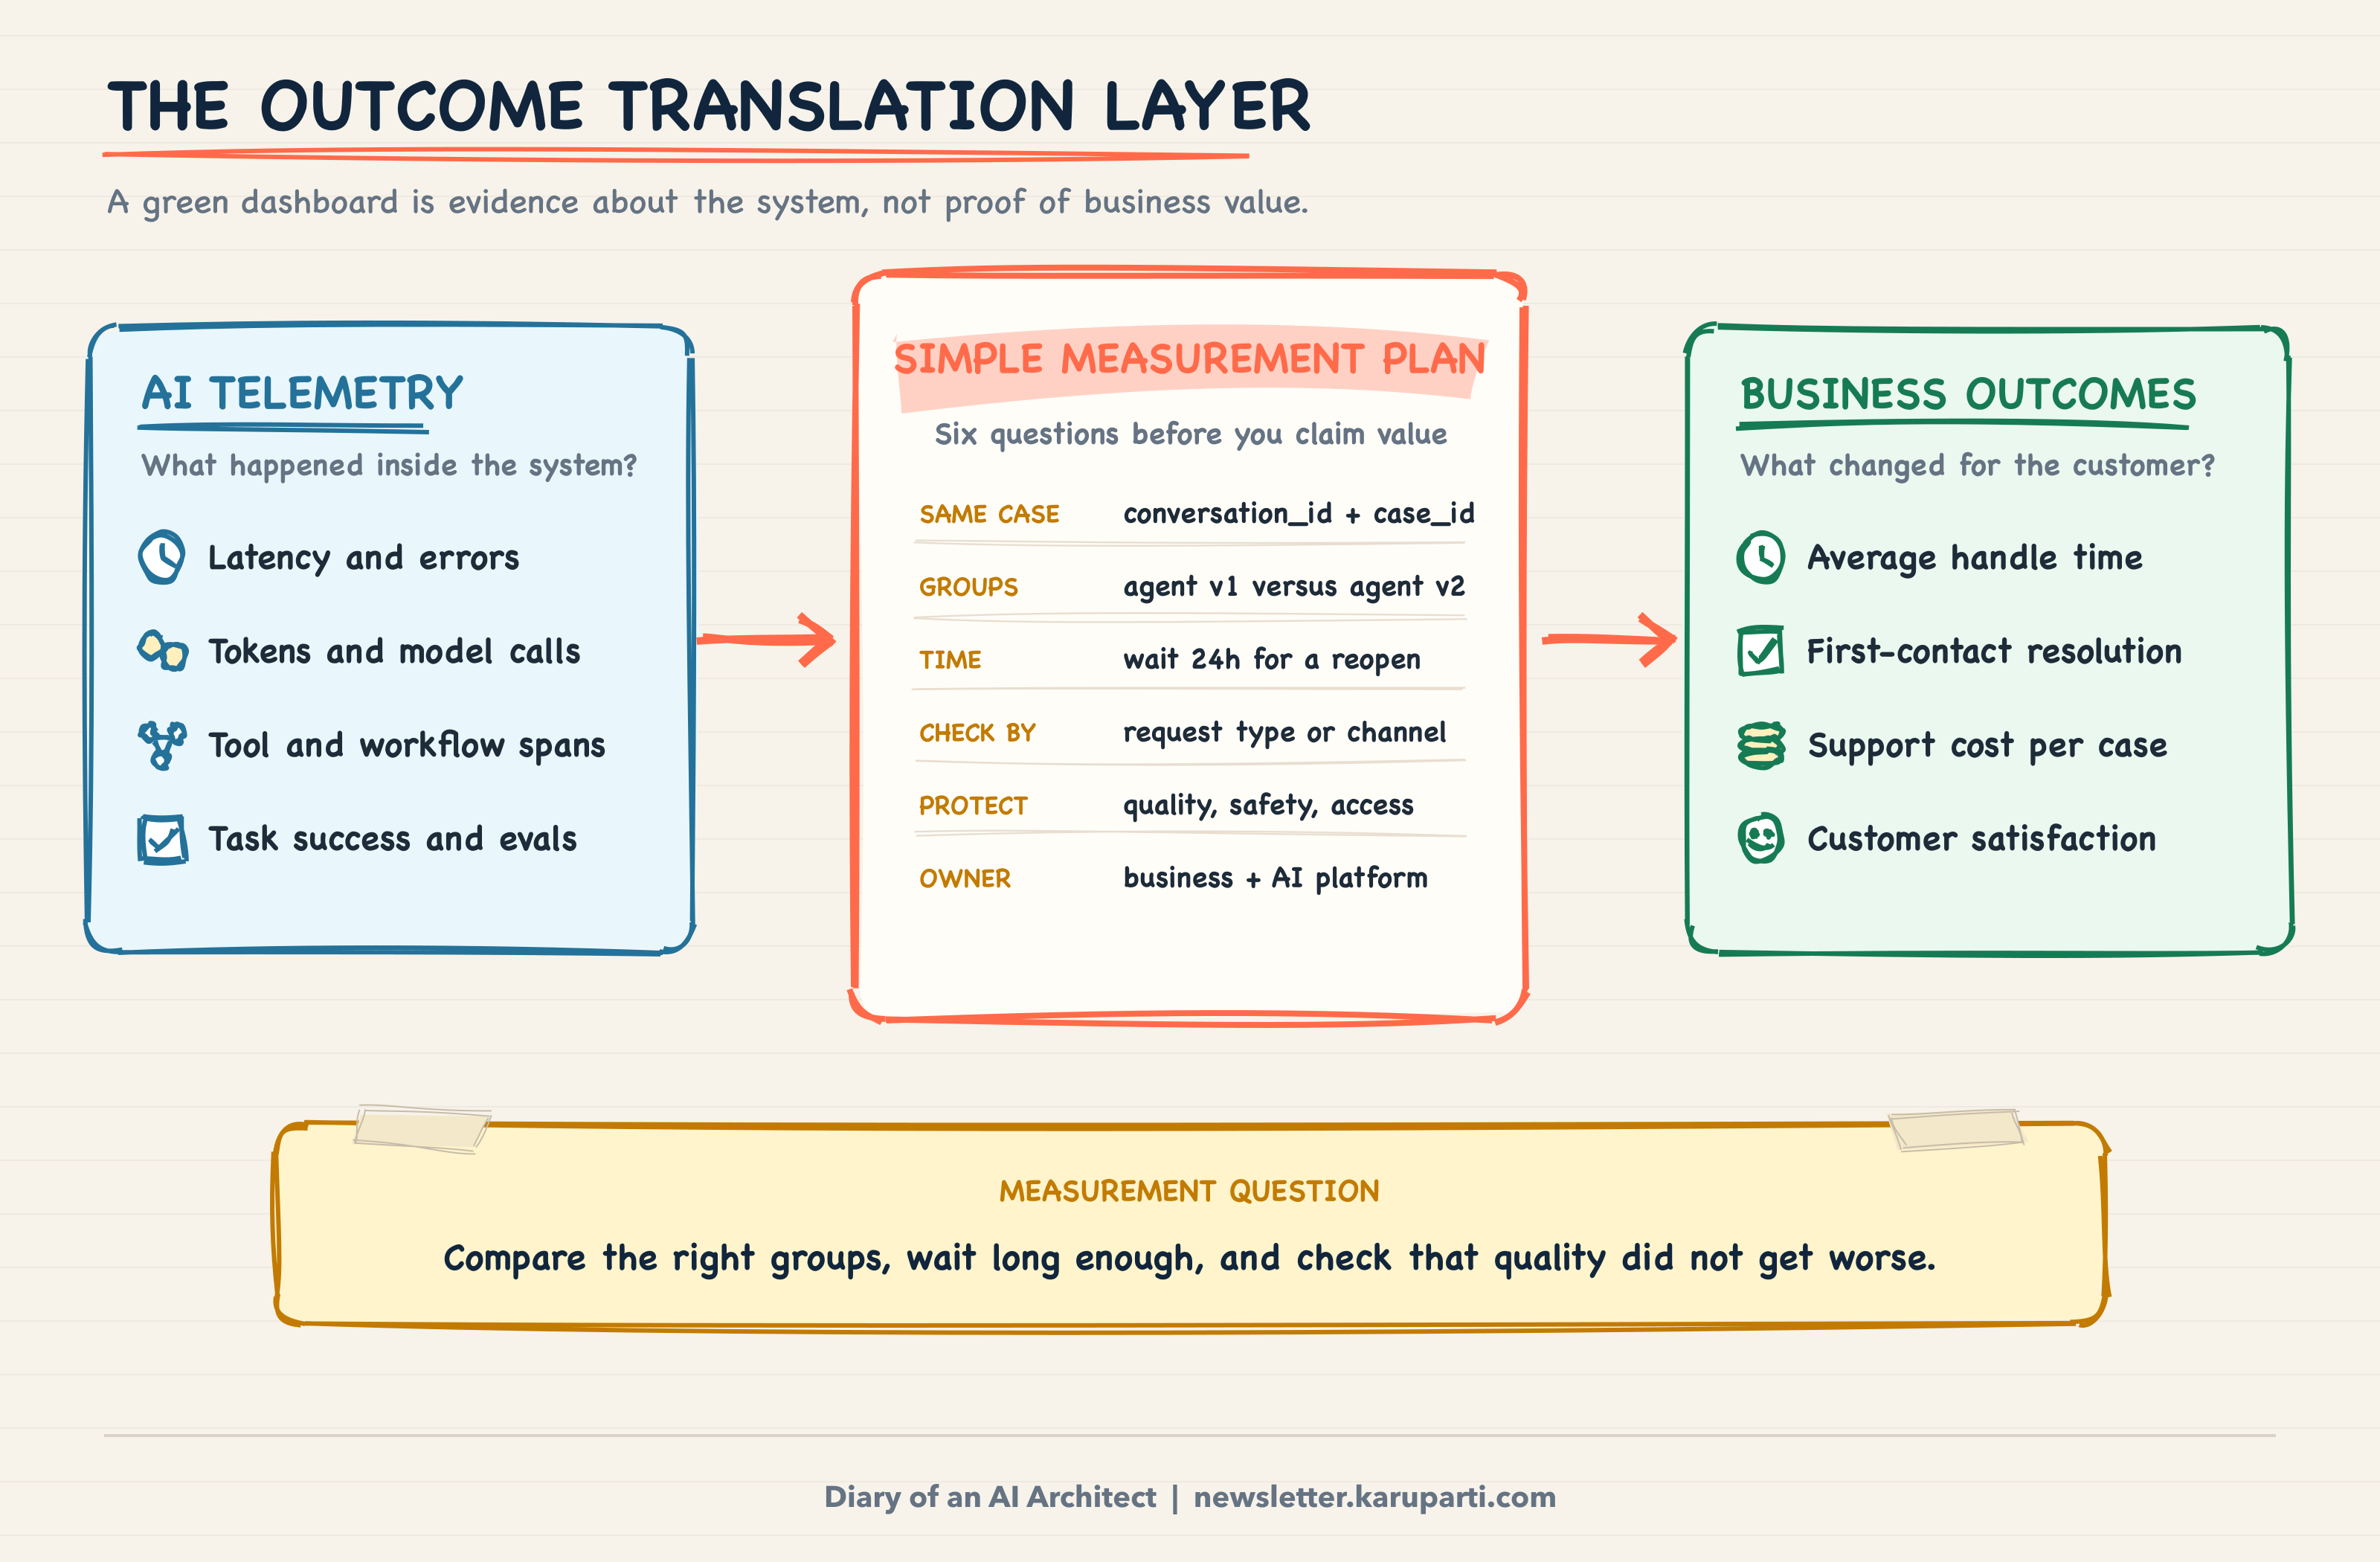
I call the missing architecture the Outcome Translation Layer. It connects AI telemetry to business records and asks one simple question: when this technical signal moves, does a business result move too?
Technical question: Is the agent working well?
  -> latency, errors, task success, eval scores

Business question: Did the customer or business improve?
  -> handle time, resolution, support cost, satisfaction

Simple measurement plan (depends on your use case):
  -> same case + groups to compare + time to wait
  -> what must not get worse + decision owner
This is not a proof machine. Lower latency does not automatically cause lower handle time.
A higher task-success score does not automatically mean more customers resolved their issue.
It is a shared plan for testing whether a technical improvement leads to a business improvement.
You may hear analysts call the groups a cohort, the time to wait a window, the customer type a segment, and the must-not-get-worse checks guardrails. I will use the plain-English terms below.
The six questions that matter
A useful measurement plan does not need analytics jargon. Engineering and the business owner only need to agree on six questions.
What business result matters? Name the number the business wants to improve.
Which technical signal may influence it? Pick one early signal, such as task success or latency.
What shared ID connects the records? Use a real conversation or case ID that exists in both systems.
Which groups will we compare, and for how long? Decide who saw each agent version and how long to wait for the result.
What must not get worse? Protect quality, safety, customer satisfaction, and access.
Who makes the decision? Name the person who can scale, investigate, or stop the rollout.
Maya’s returns example
Suppose Maya wants fewer customers to contact support twice about the same return. Her business result is first-contact resolution: did the customer’s issue stay resolved after the first conversation?
Engineering chooses agent task success as the technical signal. For this workflow, success does not mean the agent produced an answer. It means the agent checked the order, applied the return policy correctly, and created the return without a human fixing it later.
Every conversation already has a support case number. Engineering adds that same case number to the agent trace. Now the team can connect what the agent did with what happened to the customer afterward.
The team sends one group of return requests to the current agent and another comparable group to the new version. They wait 24 hours to see whether either group contacts support again about the same case.
They also agree that customer satisfaction, transfer rates, and policy violations must not get worse. If the new agent resolves more cases but creates more policy mistakes, it is not a win.
At the end of the test, Maya and the AI platform owner review the results together. They decide whether to expand the new version, investigate a problem, or stop the rollout.
That is the Outcome Translation Layer in plain English. The agent trace says, “the return task completed successfully.” The support record says, “the customer did not come back within 24 hours.” The shared case number connects those two statements.
The comparison groups, waiting period, quality checks, and named owners turn that connection into evidence the business can use.
Translation 1: latency to average handle time
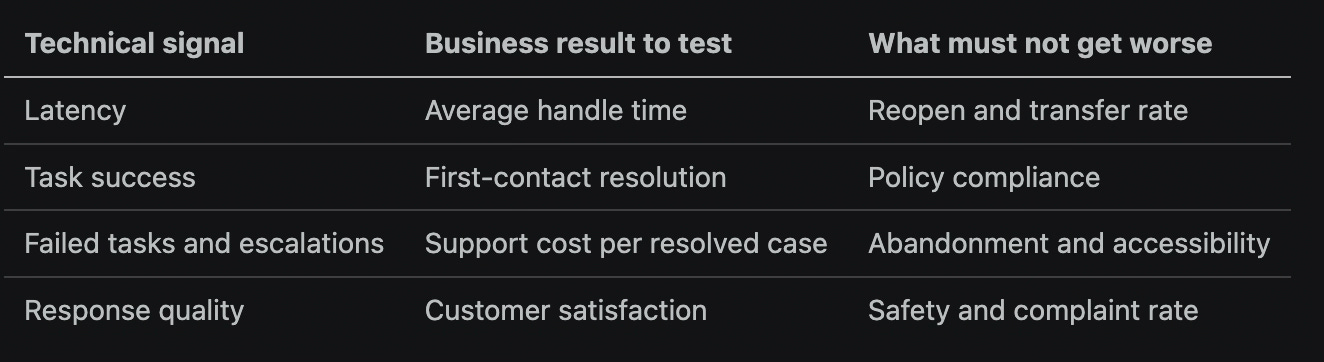
Latency is an operational measurement. Average handle time, by contrast, covers the customer interaction from start to finish. Faster model responses may reduce it, but only if they reduce the whole interaction.
An agent can answer quickly and still increase handle time through extra clarifying turns, incorrect actions, human transfers, or reopened cases. That is why I would join model and workflow timing to a real conversation or case, then compare total handle time across agent versions and customer intents.
For this contract, the measurement question becomes: when agent latency changes, does end-to-end handle time change in the same cohort, without increasing transfers, reopens, or abandonment?
Translation 2: task success to first-contact resolution
Task success is only valuable if the task definition matches the customer’s job.
A tool call returning HTTP 200 is not a resolved return. A workflow reaching its terminal node is not proof that the customer received the right outcome.
I define application-level task success against a business acceptance condition: the refund was correctly issued, the replacement was created, or the policy question was answered without another contact.
Then I join that event to the case record and observe whether the case reopened inside the agreed window.
This is where my earlier edition on the three-layer Eval Stack connects to the Outcome Translation Layer.
Evals tell us whether the agent’s behavior met a quality contract. Outcome translation tells us whether that behavior changed what happened to the business process.
“Task success improved from 88% to 94%” is an engineering result. “First-contact resolution improved from 71% to 78%” would be a business result, but both ranges here are illustrative, and the second still needs a valid cohort, window, and confounder review before anyone claims causation.
Translation 3: failed tasks and escalations to support cost
Failure counts are not costs. Two failed tasks can have radically different consequences: one triggers a five-minute correction, while another creates a regulatory escalation and hours of specialist work.
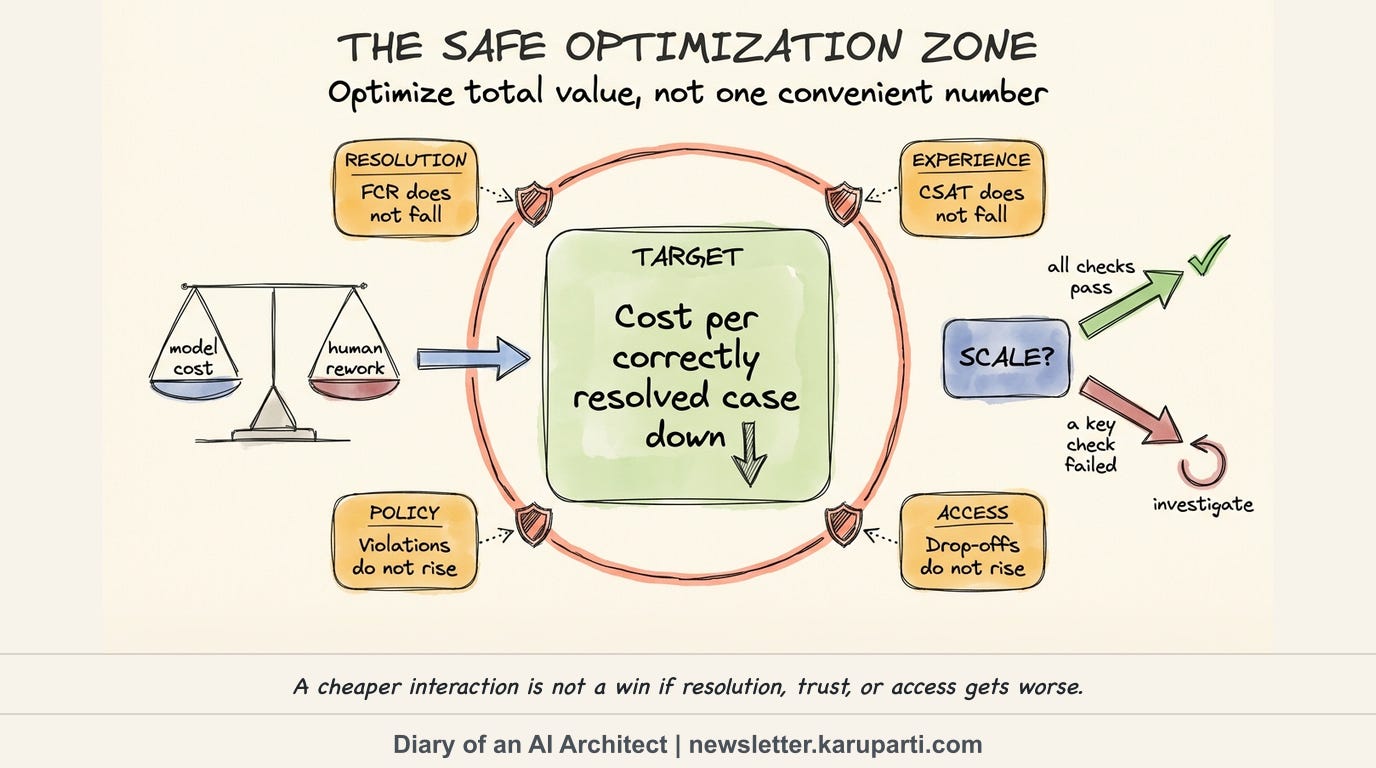
This makes the trade-off visible. A more capable model may cost more per call but reduce rework. A cheaper model may lower inference spend while creating enough escalations to increase total support cost.
The right question is not, “Did AI cost go down?” It is, “Did total cost per correctly resolved case go down, with quality and access protected?”
Translation 4: response quality to customer satisfaction
Response quality is usually measured with rules, human review, or an LLM judge. Customer satisfaction is reported by the customer. They are related signals, but they come from different observers.
I would keep both. The quality evaluation catches policy, clarity, groundedness, and tone problems even when a survey is missing. The customer score reveals whether technically acceptable responses actually felt helpful.
The join must be handled carefully. OpenTelemetry notes that captured prompts, system instructions, and model outputs can contain sensitive or personally identifiable data, and content capture is opt-in. The Outcome Translation Layer should prefer stable identifiers and derived scores over copying raw customer text into every analytics system.
NIST’s AI Risk Management Framework Measure guidance reinforces this broader approach: evaluate under deployment-like conditions, monitor in production, use field data and affected-user feedback, involve domain experts, and document measurable improvements or declines. A model-quality score alone cannot do that job.
The architecture: two lanes and one governed join
I think about this as two event lanes that meet in a governed analysis layer.
The telemetry lane contains traces, metrics, agent version, tool calls, application-defined task outcomes, and eval scores.
The business lane contains case status, interaction duration, transfer events, reopen events, survey results, and cost records.
The Outcome Translation Layer joins only what the measurement contract permits. It applies the agreed window, cohort, segment, and guardrails before producing evidence for a decision.
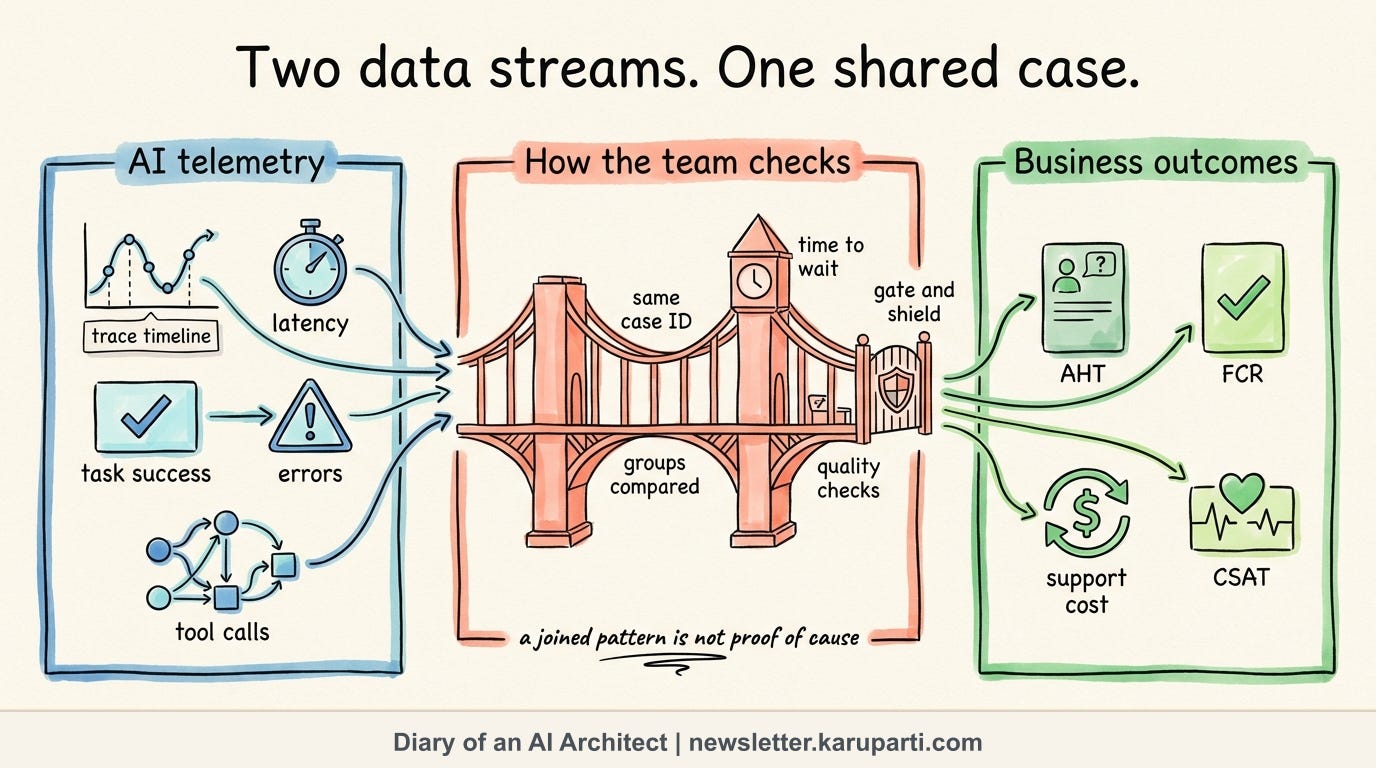
This design also creates a useful ownership boundary. Platform teams own reliable telemetry. Business teams own outcome definitions. A shared measurement owner owns the contract and the decision rule.
Correlation is the start, not the verdict
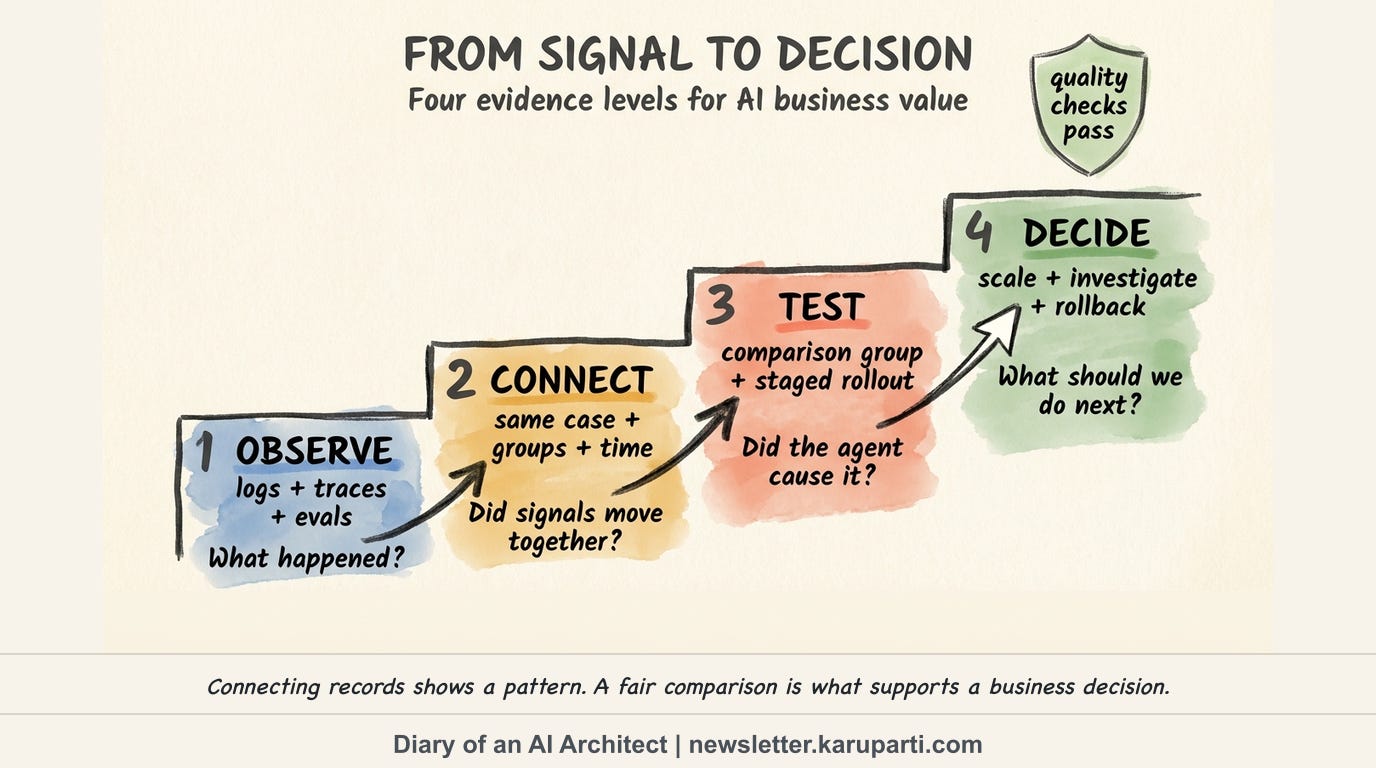
Joining two datasets does not prove the agent caused the movement. Seasonality, routing changes, policy changes, staffing, promotions, and customer mix can all move the same KPI.
Start with correlation to find a plausible relationship. Then use a staged rollout, holdout, or controlled cohort where the risk allows it. Record the agent version and experiment assignment in the contract so the comparison survives a deployment.
I also pair every target metric with a guardrail. Zendesk’s current guidance on average handle time makes the reason concrete: a low AHT can indicate efficient service, but it can also reflect rushed or unresolved interactions. AHT should be read alongside customer satisfaction, first-contact resolution, and customer effort.
This prevents Goodhart’s Law from turning the Outcome Translation Layer into a new dashboard theater.
When a measure becomes the target, teams will optimize it. Guardrails make the optimization honest.
How I would apply this with Maya’s team
I would not begin by connecting every trace to every enterprise system. I would choose one high-volume intent, one business outcome, and one accountable owner.
For a returns workflow, the first contract might target first-contact resolution. Engineering would emit genuine conversation_id, case_id, agent_version, task acceptance, latency percentiles, and eval scores.
Customer Service would define resolution, the reopen window, eligible channels, excluded cases, and the minimum CSAT and policy guardrails.
The team would then run a staged cohort. If task success improves but first-contact resolution stays flat, the translation failed and the agent may be optimizing the wrong task.
If both move while policy violations or transfers worsen, the deployment still fails the contract.
If first-contact resolution improves in the exposed cohort, holds across priority segments, and survives the guardrails, Maya finally has evidence that belongs in a business review. The green dashboard remains useful, but it is no longer the destination.
A quick shameless plug: Microsoft recently featured my presentation on Agentic AI Security on its YouTube channel. I break down emerging attack patterns targeting AI agents and show how to strengthen their defenses with automated red teaming in Microsoft Foundry. Watch it here:
The bottom line
Production AI is not successful because the dashboard is green. It is successful when a governed measurement contract shows that the business metric moved without sacrificing quality, safety, or access.
Observability explains the system. The Outcome Translation Layer explains whether the system was worth operating.
♻️ If this was useful, share it with someone building with AI.
✉️ Subscribe at newsletter.karuparti.com so you never miss an edition.

Anu Karuparti
Creator, Diary of an AI Architect
How enterprises actually ship AI to production
Read by 3,000+ FDEs, AI Architects, and Engineering Leaders from Microsoft, Google, IBM, PwC and others.
Connect with me on LinkedIn.
Want to partner? Email me at anurag.karuparti@gmail.com.
P.S. Want more? 👋
1/ My visual guide to agentic AI → Gumroad
2/ Daily deep dives on agentic AI architecture → LinkedIn
3/ Real-time takes on breaking AI news → X
4/ Casual hot takes and community → Threads
5/ Visual frameworks and carousels → Instagram
6/ 60-second production lessons → TikTok
7/ The full newsletter, free → newsletter.karuparti.com